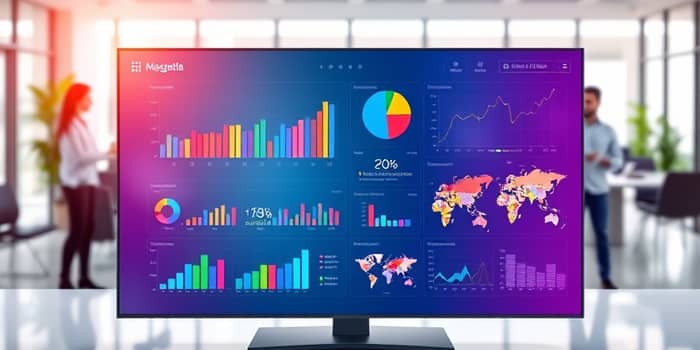
In an era where information flows at lightning speed, organizations that harness the power of data gain a decisive advantage. Digital dashboards empower teams to transform raw numbers into clear visuals, enabling stakeholders to make strategic decisions with confidence. Whether you are leading a Fortune 500 company or steering a startup, mastering dashboard technology can revolutionize how you track progress, optimize resources, and spark innovation.
A digital dashboard is more than a static report: it is a visual interface that displays key metrics in an integrated, user-friendly format. By consolidating information from disparate sources—databases, spreadsheets, cloud applications—dashboards offer a single source of truth for teams across departments.
At its core, a dashboard turns complex data into an easily digestible display. Rather than sifting through lengthy spreadsheets, users can glance at charts, gauges, and indicators to gauge progress, identify trends, and spot anomalies. This immediacy fuels proactive decision-making, as managers react to changing conditions in real time.
Not all dashboards are created equal. Leading platforms combine functionality, security, and collaboration tools. Key features include:
Organizations worldwide reap tangible benefits when they adopt digital dashboards. By automating data collection, dashboards deliver time savings and error reduction, freeing analysts to focus on insights rather than data wrangling. Teams synchronize on the same up-to-date metrics, diminishing information silos and accelerating alignment.
Consider a marketing team monitoring website traffic and conversion rates. A well-designed dashboard highlights trends, pinpoints drop-offs, and triggers alerts when performance dips below targets. Armed with this visibility, marketers can optimize campaigns in real time, maximizing return on ad spend and boosting customer engagement.
Dashboards can be tailored to specific functions or objectives. Below is an overview of common dashboard types and their core benefits:
Rolling out dashboards requires careful planning. Start by defining goals and understanding who will consume the data. Design with end users in mind—executives need high-level summaries, while analysts may require detailed drill-downs.
When choosing a platform, evaluate features such as integration capabilities, real-time processing, and security controls. Popular tools include Tableau, Power BI, and Looker Studio, yet custom-built solutions can deliver tailored experiences for unique workflows.
Even the best dashboards falter if they become cluttered or outdated. Guard against information overload by prioritizing clarity and relevance. Regularly revisit KPIs to reflect evolving goals and weed out unnecessary metrics.
Empower users with training sessions or embedded context notes to interpret complex visuals accurately. Foster a data-driven culture by encouraging teams to leverage dashboards in meetings, project planning, and performance reviews.
Digital dashboards represent the bridge between raw data and strategic action. By consolidating metrics, automating reports, and delivering always-current, intuitive visuals, dashboards empower every team member to contribute to organizational success.
As data continues to proliferate, mastering dashboard technology will become a core competency for businesses of all sizes. Begin your journey today: identify key metrics, choose the right platform, and cultivate a culture where insights drive innovation. In doing so, you will transform performance monitoring from a reactive chore into a dynamic catalyst for growth.
References


